The product line
Every product runs on the same living ledger.
Benchmarks built from the books: public research from the anonymized, aggregated accounting records of small businesses whose books Uplinq maintains.
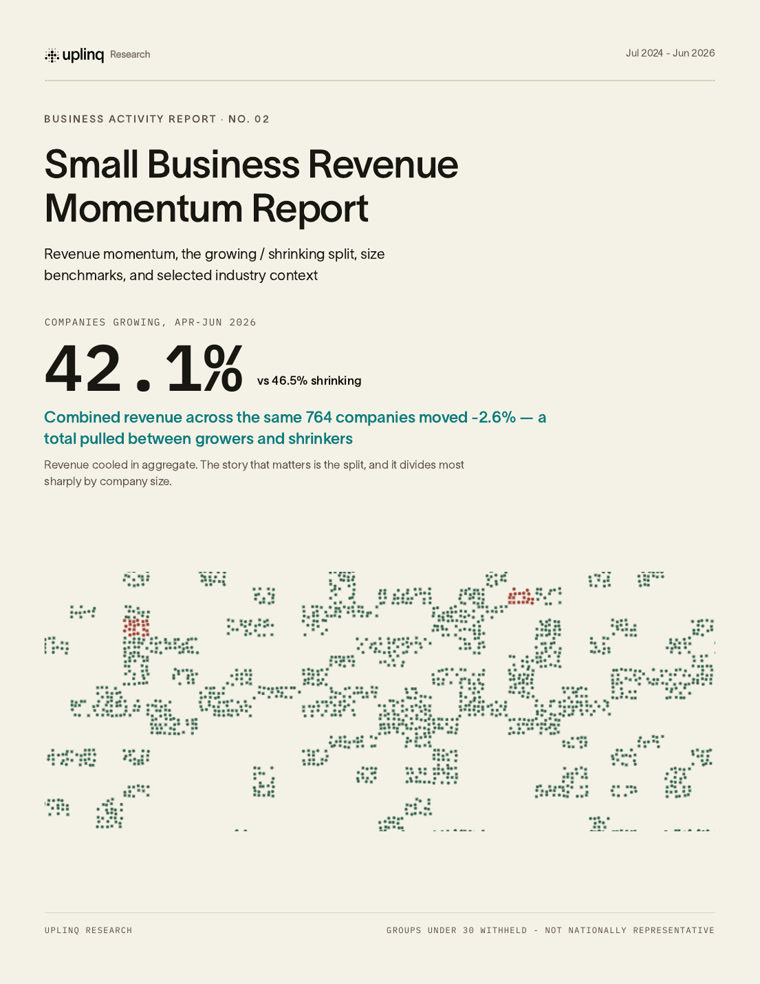
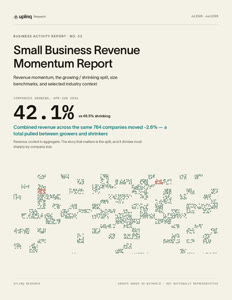
Revenue momentum, the growing and shrinking split, size benchmarks, and selected industry context.
Submit your email to unlock the PDF. This does not subscribe you to marketing.
Each report states its coverage, suppression rules, and claim boundaries.
Every figure is computed from anonymized, aggregated accounting records. Small cells are withheld. Claims ship with their boundaries.
No raw records. No identifiable businesses. Ever. Coverage and methodology appear in each published report.Anonymized ledgers of businesses whose books Uplinq maintains.
Businesses must have enough operating history inside the measurement window.
Monthly grain, revenue-normalized where appropriate, with dates disclosed per report.
Medians, shares, and indexed movement only; no record-level data leaves the system.
Public chart cells suppress below 30 companies and prefer at least 50 companies.
Reflects Uplinq's customer mix; weights and exclusions are disclosed in each release.
One email per release. Methodology included.